INTRODUCTION
Stroke is one of the leading causes of mortality and disability globally 1,2 Stroke can be defined as “an acute neurologic dysfunction of vascular origin with sudden (within seconds) or at least rapid (within hours) occurrence of symptoms and signs corresponding to the involvement of focal or global areas in the brain. The neurologic deficit usually occurred more than 24 hours after the onset of symptoms, or died within 24 hours, and other causes have been eliminated.3 Risk factors can be divided into two types: modifiable and non-modifiable. Non-modifiable risk factors such as age, gender, and genetics. Modifiable factors include hypertension, diabetes, smoking, and hyperlipidemia 3 The derangements in the lipid profile have been suggested as a risk factor for the development of stroke.1,2
Dyslipidemia is diagnosed based on National Cholesterol Education Program Adult Treatment Panel III (NCEP-ATP III) which consists total cholesterol (TC) > 240 mg/dL, low density lipoprotein cholesterol (LDLc) > 160 mg/dL, high density lipoprotein cholesterol (HDLc) < 40 mg/dL in male or < 50 mg/dL in female, triglyceride (TG) > 200 mg/dL. But there were inconsistent results on the association between lipid profile and the occurrence of stroke. 4 To increase the predictor value of lipid profile to stroke outcome, several lipoprotein ratios, called atherogenic indexes, have been suggested. This was first proposed as a biomarker of plasma atherosclerosis by Dobiásová and Frohlich, which is calculated as log (TG/ HDL), and reflects the circulating concentrations of TG and HDLc. 5.
The value of the Atherogenic Index of Plasma (AIP) is directly proportional to the risk of cardiovascular and cerebrovascular disease. AIP indirectly reflects the size of small dense low-density lipoproteins (sdLDL) particles, which can easily slip into the wall of blood vessels and form atherosclerotic plaque. The use of triglyceride (TG) and high-density lipoprotein (HDL) values in this ratio reflects multiple interactions of lipoprotein metabolism, and it is useful to predict plasma atherogenicity. Studies have suggested AIP as a novel biomarker for dyslipidemia that can be used to predict the severity of acute ischemic stroke 6 ,7 and a predictor of insulin resistance (IR) risk.2,5
Atherogenic index of plasma (AIP) represents the lipid profile of atherogenic dyslipidemia and is associated with various atherosclerosis, metabolic diseases, and cardiovascular diseases. 4 Lipid indices have been used by several studies to assess atherogenic dyslipidaemia, metabolic syndrome, and insulin resistance based on a positive correlation to cholesterol esterification rates, lipoprotein particle size, and remnant lipoproteinaemia. Also, epidemiologic reports have shown that AIP is significantly related to coronary heart disease, the risk of ischemic stroke and can positively predict poor prognosis in ischemic stroke patients. However, studies in patients with cerebrovascular disease are still insufficient. 1,2,,8 It is also considered a predictor for rapid plaque progression beyond traditional risk factors.9
It has been emphasized that in an attempt to optimize the predictive capacity of the lipid profile, several lipoprotein ratios or “atherogenic indices” have been defined. The various atherogenic indices are atherogenic index of plasma (AIP), Castelli Risk Index I and II (CRI), the atherogenic coefficient (AC), and non-high density lipoprotein cholesterol (HDLc) (NHC). AIP is based on two important parameters: plasma triglyceride and plasma HDLc. The concurrent use of triglycerides and HDLc in this ratio reflects the multiple interactions among the metabolism of different lipoproteins and can be useful for predicting plasma atherogenicity.2,10
Studies have shown that lipid indices calculated from parameters of lipid profile were found to have better predictive capacity in cardiovascular disease and traditional lipid parameters 8,11 But very few studies have commented on the status of lipid indices in stroke patients. 2,3. Therefore, this study was designed to investigate the risk of the occurrence of stroke using atherogenic indices calculated from traditional lipid profiles.
METHODOLOGY
This was case-control study comprising of sixty-seven patients, newly diagnosed with stroke after CT-Scan confirmation. Another Sixty-seven apparently healthy normotensive, age and sex matched volunteers were recruited from Ogbomoso Community as controls. The cases were recruited via Accident and Emergency units of LAUTECH Teaching Hospital, a state-owned tertiary facility and Bowen Teaching Hospital, a private tertiary facility. Both are located in Ogbomoso North Local Government Area and Ogbomoso South Local Government, respectively. The facilities serve as referral centres for other facilities in Ogbomoso and its environs. Informed consents were obtained from both groups.
A semi-structured questionnaire was used as the survey instrument to seek information on subjects’ and controls’ socio-demographic characteristics, risk factors for stroke, duration and number of stroke episodes and drug history. Anthropometric parameters were measured, and an overnight 10 ml venous blood sample was taken from each consenting subject following aseptic procedure of phlebotomy into a lithium Heparin specimen bottle. The sample, after collection, was centrifuged at 3000 rpm for easy separation of supernatant plasma. The separated plasma sample was stored frozen at – 20°C until the time of the analysis. And was used for the laboratory analysis of the lipid profile parameters (Total Cholesterol, HDL-c, Triglyceride). Enzymatic end point was used for lipid profile parameters except LDLc, with commercially available ready-to-use kits by Randox Laboratories Limited, Crumlin, United Kingdom. The assays were carried out based on the instructions as stated in the manufacturer’s manual. LDLc was estimated using Friedewald’s formula.12
Each participant had his/her weight measured in kilograms (kg) using a standard hospital weighing scale. Subjects were dressed in minimal clothing with shoes off. Height in meters (m) was measured against a graduated height scale (stadiometer) with patients in erect position and unshod. Body mass index (BMI) was calculated from the weight and height as follows: BMI = weight (kg)/Height2 (m2). Percentage body fat was determined by measuring suprailiac skinfold using Warrior Digital Mass Caliper (Sequoia Fitness Products USA).
The lipid indices, Atherogenic Index of Plasma (AIP), Castelli’s Risk Index (CR-I and II), and Atherogenic Coefficient (AC), were calculated from lipid profile parameters and graded based on the study by Dobiasova et al. AIP values of-0.3 – 0.1(low), 0.10-0.24 (medium) and above 0.24 (high) cardiovascular risk. AIP is calculated as: AIP = Log (serum triglyceride/plasma HDLc). CRI-I and II are two important indicators of vascular risk, the predictive value of which is greater than the isolated lipid parameters. They are calculated as per the given formulae: CRI-I = Plasma total cholesterol/plasma HDLc, CR-I II = Plasma low-density lipoprotein (LDL)- cholesterol/plasma HDLc, AC is calculated as: atherogenic coefficient (AC) = (Total cholesterol−HDLc)/HDLc, and non-HDLc (NHC) = Total cholesterol–HDL. Or (Plasma total Cholesterol−Serum HDLc)/HDLc. NHC represents the cholesterol content present in all the atherogenic lipoproteins 1,2
Dyslipidaemia was defined as normal or abnormal, using the third report of the National Cholesterol Education Programme expert panel on detection, evaluation, and treatment of high blood cholesterol in adults (NCEP ATP III). Levels of TC ≥200mg/dl, LDL ≥130mg/dl and TG ≥150mg/dl were elevated, while HDL ≤40mg/dl and ≤50mg/dl were low for males and females, respectively.13
Statistical Analysis
Data were entered and analysed using SPSS version 25.0. The results were presented using descriptive and inferential statistics. Continuous variables were summarised using mean and frequency. Student t-test and chi-square were used for measures of comparison within biochemical variables. ROC and logistic regression were used for the prediction of occurrence. The level of significance was set at p< 0.05.
Ethical Approval and Consent to Participate
Ethical approval was obtained from ethical review committee of Ladoke Akintola University of Technology Teaching Hospital, Ogbomoso. Written informed consent was taken from each participant after an adequate explanation of the objectives of the study and the benefits of the study before recruitment into the study. Respondents were told that the participation of persons was voluntary. All other processes of recruitment adhere strictly to the guidelines stipulated by the Helsinki declaration. All information gathered was kept confidential, and participants were identified using only serial numbers.
RESULTS
A total number of 134 participants were recruited for this study comprising of 67 newly diagnosed stroke patients as subjects and 67 apparently heathy as control. No significant difference in the mean age between the case (64.51±15.71 years) and control (61.388±14.42 years), p-value=0.233. However, all anthropometric parameters show a significant difference between cases and controls, except WHR. For SBP Cases (153.07±29.78 mmHg) compared to control (117.10±16.81 mmHg) and p-<0.001. while DBP for cases (89.69±17.85 mmHg) compared to (71.03±11.72 mmHg) for controls, P- value<0.001. Percentage Body fat, cases (33.51±6.11%) and controls (30.30±7.97%) with p<0.001. BMI for cases (26.52±4.120) while for controls (24.12±5.77), P-value<0.007. (Table 1)
The mean values for cases were significantly higher than controls for the lipid profiles except for triglycerides. TC for case (4.62±1.42mml/L) compared with controls (4.00±0.91mml/L). While for HDLc, the cases were (0.75±0.32mml/L) compared with the controls (1.26±0.37 mmol/L). Value of LDLc for cases (3.34±1.44) compared with controls (2.29±0.80). Non-HDLc for cases (3.87±1.46mml/L) compared with controls (2.74±0.90). The p-values were <0.001. Triglyceride values for case and controls were 1.16±0.68mml/L and 0.98±0.45mml/L respectively, p-value=0.07. All the atherogenic indices were significantly higher among the cases compared with the control group. AIP has values for cases (0.15±0.32) and controls (-0.14±0.25). CRI-I value for cases (7.50±4.90) compared to controls (3.36±1.03). For CRI-II cases (5.63±4.40) compared to controls (1.98±0.89) and lastly, AC for case (6.50±4.91) and controls (2.36±1.03). All p-values <0.001. (Table 2)
Assessing cardiovascular risks among cases, using level of abnormal lipid profile as defined by Programme expert panel on detection, evaluation, and treatment of high blood cholesterol in adults (NCEP ATP III); 22(32.8%), 27(40.3%), 59(88.1%) and 3(4.5%), had abnormal level for TC, LDLc, HDLc and Trig respectively. While AIP, 24(35.8%) show a high risk for cardiovascular disease. For CRI-I; 49(73.1%), CRI-II; 44(65.7%), and AC; 49(73.1%) had increased risk for cardiovascular events. All were statistically significant (p-values <0.001) when compared with controls, except triglycerides. (table 3)
The predictive value of lipid profiles and atherogenic indices for the occurrence of cardiovascular events among cases was demonstrated using the Receiver Operating Characteristic (ROC) curve. Although, all the parameters were significant, but demonstrated varying degrees of predictive ability as shown on the ROC curve. This also demonstrates the sensitivity of each parameter in predicting cardiovascular occurrences. The Area under the Curve (AUC) shows that all the components of lipid profiles had poor predictive value except LDLc, which had good predictive value. On the other hand, the components of the atherogenic indices demonstrated very good predictive ability. CRI-I and AC demonstrated the highest predictive values of 0.877, followed closely by CRI-II with an AUC of 0.861. HDL- C has the least AUC of 0.104. Other predictive indices, as shown by AUC values, are AIP (0.739), LDLc (0.705), TC (0.599), and HDL (0.531). (table 4 and figure 1)
DISCUSSION
Stroke is a disease of public health importance because of the significant morbidity and mortality it causes worldwide. Lipid profile derangements have been suggested as a risk factor for the development of stroke, various studies show inconsistent results on the association between lipid profile and occurrence of stroke.1 This study was designed to demonstrate the predictive index of atherogenic indices, parameters calculated from the traditional lipid profile to enhance their diagnostic and prognostic ability. The study found significantly higher mean values of anthropometric parameters in cases compared with controls. Elevated levels of Anthropometric parameters like blood pressure, BMI, WHR, and percentage body fat have been found to contribute significantly to the occurrence of cardiovascular events such as modifiable risk factors.14,15 Similar findings were also observed in the current study. Abnormal value of anthropometric measures is a reflection of insulin resistance and development of metabolic syndromes (dyslipidemias, high blood pressure, abnormal BMI and glucose intolerance).16,17.
The plasma levels of TC, HDLc, LDLc and Non-HDLc were significantly higher in the cases when compared with controls. This has also been demonstrated by many studies. Dyslipidemias (high level of TC, LDLc, Trig and low level of HDLc) has been reported by many studies as risk factors for stroke and optima or desirable level of LDLc and TC are being advocated for as primary preventive measures for the occurrence of stroke and other cardiovascular events, as defined by panel on detection, evaluation, and treatment of high blood cholesterol in adults (NCEP ATP III).13
However, the study found low plasma levels of triglyceride in both cases and controls, and there was no significant difference, even though hypertriglyceridemia has been reported as an independent risk factor for stroke.18 Some studies reported low plasma levels of triglyceride as associated with poor prognosis in stroke survivors, while others linked it with prior poor nutritional status.19,20 The low triglyceride recorded in this study is in line with the triglyceride paradox in blacks, where blacks are known to have low plasma levels 21,22,23,24 Like traditional lipid profiles, cases have significantly higher values of atherogenic indices (Non-HDLc, AIP, CRI-I, CRI-II and
- AC) than control Many previous studies have well established this. 5,8 These lipid indexes have been found to predict atherogenic dyslipidemias, metabolic diseases and cardiovascular diseases.6 Also, AIP is significantly related to coronary heart disease, the risk of ischemic stroke and can positively predict poor prognosis in ischemic stroke patients. 25 Studies are looking at the indices as a better predictor of cardiovascular events and prognosis.
In comparing cardiovascular risk among cases and controls, abnormal lipid levels are used as defined by the Programme Expert Panel on the detection, evaluation, and treatment of high blood cholesterol in adults (NCEP ATP III).13 in our study, as shown in Table 3, Cases have a greater percentage of abnormal lipid levels compared to controls, and the difference is highly significant. This is in line with findings from other studies that have reported dyslipidemias as a traditional risk factor for cardiovascular events.4,5 Though several other studies observed an inconsequential relationship between dyslipidemias and stroke.4,26,27
Normal lipid levels have been observed in some stroke survivors.28 This prompted the concept of lipid indices, as first described by Dobiásová and Frohlich, to increase the predictive index of lipids as a biomarker of cardiovascular events.5
Furthermore, atherogenic indices were used to assess the risk of cardiovascular events among cases and controls. This current study found a significant difference in the risk of cardiovascular events among cases compared with controls. However, the components of atherogenic indices have a greater percentage of cases than the controls with increased risk of cardiovascular events compared with traditional lipid profiles. This is in line with reports from several studies that atherogenic indices are better predictors of stroke than ordinary lipid profiles.1,2,4,8,11 In an attempt to optimize the predictive capacity of the lipid profile, several lipoprotein ratios or “atherogenic indices” have been defined as demonstrated in this study. The various atherogenic indices are atherogenic index of plasma (AIP), Castelli Risk Index I and II (CRI), atherogenic coefficient (AC), and non- high density lipoprotein cholesterol (HDLc) (NHC).
Atherogenic index of plasma (AIP) is an index representing the lipid profile of atherogenic dyslipidemia and has been shown to be associated with various atherosclerosis, metabolic diseases, and cardiovascular diseases.4
Given the above findings, the Receiver Operating Characteristic (ROC) curve was used to demonstrate the Predictive values of components of lipid profiles and atherogenic indices among stroke patients. The value of Area Under the Curve used to evaluate the predictive index. This is shown in Table 4 and demonstrated in Figure 1. Although lipid profile was able to demonstrate a significant difference between cases and controls, but has low predictive ability within stroke patients when compared with atherogenic indices. The best lipid profile, LDLc with AUC of 0.705, has a lower predictive value than the least atherogenic components, which is the Atherogenic Index of Plasma (AIP) with a predictive value of 0.737. The other components demonstrated very good predictive values. Casetelli’s Risk Index-I (CRI-I) and Atherogenic Coefficient (AC) have the highest AUC of 0.877, followed closely by Casetelli’s Risk Index-II with AUC of 0.861. These findings support the observations suggested by several studies that, “to increase predictive value of lipid profile to stroke occurrence and outcome, lipoprotein ratios, termed as atherogenic index should be studied”.1,2,3,4. The findings of this study has confirmed atherogenic indices as a better predictor of cardiovascular event compared to traditional lipid profiles and can be used as s novel biomarkers for cardiovascular events, as suggested by similar studies. 6,7
CONCLUSION
The findings of this study not only confirmed lipid indices (atherogenic indices) calculated from traditional lipid profiles as a better risk assessment tool but also demonstrated better predictive ability than an ordinary lipid profile. Therefore, we recommend that atherogenic indices rather than ordinary lipid profile results should be used in the interpretation, diagnosis, prognosis and therapeutic target, in the primary prevention and treatment of dyslipidemias in cardiovascular diseases. This is easy and cheap without additional cost to the patients or extraordinary efforts from the caregiver, other than simple calculations.
LIMITATIONS
The small sample size for the study may have affected the predictive value and generalizability of the study. A larger sample may be needed to improve the predictive capability of the indices.
CONFLICTS OF INTEREST
The authors declare that they have no conflict of interest.
FUNDING
The research work was self-sponsored by the authors.
Table 1. Comparison of Age and Anthropometric parameters as cardiovascular risk factors between cases and controls
| Variables | Category (Mean ± SD) | t-test | P-Values | |
|---|---|---|---|---|
| Cases (n=67) | Controls (n=67) | |||
| Age (years) | 64.51±15.71 | 61.388±14.42 | 1.198 | 0.233 |
| SBP (mmHg) | 153.07±29.78 | 117.10±16.81 | 8.608 | *<0.001 |
| DBP (mmHg) | 89.69±17.85 | 71.03±11.72 | 7.151 | *<0.001 |
| Body fat (%) | 33.51±6.11 | 30.30±7.97 | 2.618 | *0.010 |
| BMI | 26.52±4.12 | 24.12±5.77 | 2.763 | *0.007 |
| WHR | 0.94±0.21 | 0.91±0.08 | 0.816 | 0.416 |
*Statistically significant, SBP=Systolic Blood Pressure, DBP=Diastolic Blood Pressure, BMI=Body Mass Index, WHR=Waist Hip Ratio
| Category Mean± SD | t-test | P-value | ||
|---|---|---|---|---|
| Variables | Case | Control | ||
| TC | 4.62±1.42 | 4.00±0.91 | 3.037 | 0.003* |
| HDLc | 0.75±0.32 | 1.26±0.37 | -8.532 | <0.001* |
| LDLc | 3.34±1.44 | 2.29±0.80 | 5.23 | <0.001* |
| Trig | 1.16±0.68 | 0.98±0.45 | 1.83 | 0.07 |
| Non-HDLc | 3.87±1.46 | 2.74±0.90 | 5.394 | <0.001* |
| AIP | 0.15±0.32 | -0.14±0.25 | 5.862 | <0.001* |
| CRI-I | 7.50±4.90 | 3.36±1.03 | 6.752 | <0.001* |
| CRI-II | 5.63±4.40 | 1.98±0.89 | 6.661 | <0.001* |
| AC | 6.50±4.91 | 2.36±1.03 | 6.752 | <0.001* |
*Significant, TC=Total Cholesterol, HDLc=High Density Lipoproteins Cholesterol, LDLc=Low Density Lipoprotein Cholesterol, Trig=Triglyceride, AIP=Atherogenic Index of Plasma, CRI- I=Castelli’s Risk Index, CRI-II=Castelli’s Risk Index-II, AC=Atherogenic coefficient
Table 3: Cardiovascular Risk assessment using lipid profile and atherogenic indices
| Variable | Category | Statistics | |||
|---|---|---|---|---|---|
| Case (%)n=67 | Control (%)n=67 | df | ꭓ2 | P-Value | |
| Total Cholesterol | 1 | 11.558 | 0.001 | ||
| Normal | 45(67.2) | 61(91.0) | |||
| Abnormal | 22(32.8) | 6(9.0) | |||
| LDLc | 1 | 17.73 | <0.001* | ||
| Normal | 40(59.7) | 61(91.0) | |||
| Abnormal | 27(40.3) | 6(9.0) | |||
| HDLc | 1 | 16.465 | <0.001* | ||
| Normal | 8(11.9) | 29(43.3) | |||
| Abnormal | 59(88.1) | 38(56.7) | |||
| Trig | 1 | 3.069 | 0.08 | ||
| Normal | 64(95.5) | 67(100) | |||
| Abnormal | 3(4.5) | 0(0.0) | |||
| AIP | 1 | 21.056 | <0.001* | ||
| Normal | 38(56.7) | 53(79.1) | |||
| Medium Risk | 5(7.5) | 11(16.4) | |||
| High Risk | 24(35.8) | 3(4.5) | |||
| CRI-I | 1 | 34.577 | <0.001* | ||
| No Risk | 18(26.9) | 52(77.6) | |||
| Increased Risk | 49(73.1) | 15(22.4) | |||
| CRI-II | 1 | 38.237 | <0.001* | ||
| No Risk | 23(34.3) | 58(86.6) | |||
| Increased Risk | 44(65.7) | 9(13.4) | |||
| AC | 1 | 34.557 | <0.001* | ||
| No Risk | 18(26.9) | 52(77.6) | |||
| Increased Risk | 49(73.1) | 15(22.4) |
*Significant, TC=Total Cholesterol, HDLc=High Density Lipoproteins Cholesterol, LDLc=Low Density Lipoprotein Cholesterol, Trig=Triglyceride, AIP=Atherogenic Index of Plasma, CRI- I=Castelli’s Risk Index, CRI-II=Castelli’s Risk Index-II, AC=Atherogenic coefficient.
Table 4: Receiver Operating Characteristic (ROC) curve to demonstrate the Predictive value of components of lipid profiles and atherogenic indices among cases
| Variable | **AUC | P-Value |
|---|---|---|
| TC | 0.599 | 0.047* |
| LDLc | 0.705 | <0.001* |
| HDLc | 0.104 | <0.001* |
| Trig | 0.531 | 0.542 |
| AIP | 0.739 | <0.001* |
| CRI-I | 0.877 | <0.001* |
| CRI-II | 0.861 | <0.001* |
| AC | 0.877 | <0.001* |
*Significant, TC=Total Cholesterol, HDLc=High Density Lipoproteins Cholesterol, LDLc=Low Density Lipoprotein Cholesterol, Trig=Triglyceride, AIP=Atherogenic Index of Plasma, CRI-I=Castelli’s Risk Index, CRI-II=Castelli’s Risk Index-II, AC=Atherogenic coefficient.
AUC; Area Under Curve grade: (Excellent; AUC> 0.9, Very Good; 0.9 < AUC > 0.8, Good; 0.8 < AUC >0.7, Fair; 0.07 < AUC > 0.6, Poor; 0.6 < AUC
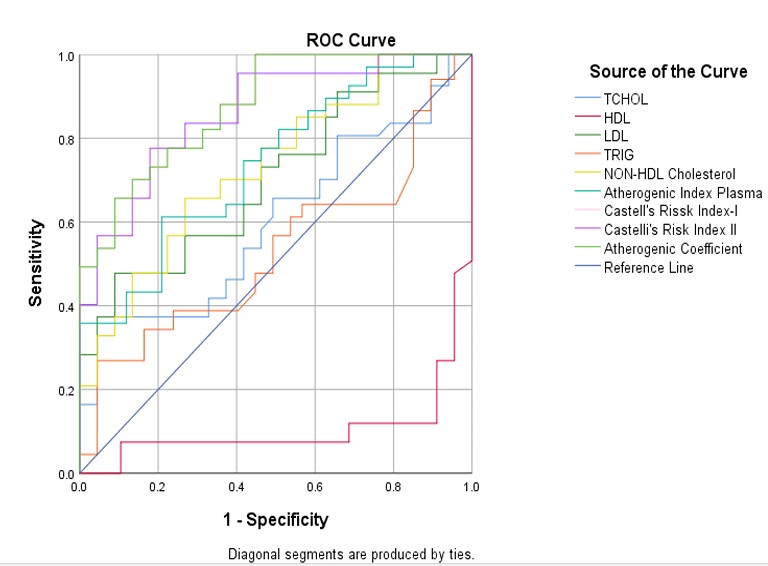
Figure 1: Receiver Operating Characteristic (ROC)
References
Sujatha, R. and Kavitha, S. Atherogenic indices in stroke patients : A retrospective study. Orig. Pap. Iran J Neurol 16, 78–82 (2017).
Longjie Q, Shuang Fang, Zhen Lan, Shuai Xu, Jialiu Jiang. et al. Association between atherogenic index of plasma and new-onset stroke in individuals with different glucose metabolism status : insights from CHARLS. Cardiovasc. Diabetol. 23, 1–11 (2024).
Febriana, S. and Ardhi, M. S. Atherogenic Index Profile on Ischemic Stroke Patients at Neurology Department, Dr Soetomo Surabaya : A Retrospective Study. Int. J. Res. Rev. 8, 332–336 (2021).
Ki-Woong, Nam, Hyung-Min, K. and Yong-Seok, L. Atherogenic Index of Plasma Predicts Early Recurrent Ischemic Lesion in Acute Ischemic Stroke ; J Neurosonol Neuroimag 14, 42–50 (2022).
Huancong Zheng, Kuangyi Wu, Weiqiang Wu, Guanzhi Chen, Zekai Chen. et al. Relationship between the cumulative exposure to atherogenic index of plasma and ischemic stroke : a retrospective cohort study. Cardiovasc. Diabetol. 22, 1–10 (2023).
Tirtana, E. F. NEUROLOGY | REVIEW ARTICLE ATHEROGENIC INDEX OF PLASMA AS A NOVEL PREDICTOR OF SEVERITY IN ACUTE ISCHEMIC. Int. J. of Medical Rev. Case Reports 6, 42–44 (2022).
Zulfikri, M., Arina, C. A. and Batubara, C. A. Correlation between atherogenic index of plasma and national institutes of health stroke scale score in acute ischemic stroke patients at Haji Adam Malik general hospital, Medan. Int. J. Res. Med. Sci. 9, 3057–3061 (2021).
Xu, F. and Zhong, X. The association between atherogenic index of plasma and stroke in Chinese middle-aged and elderly population : a national cross-sectional study. Neurol. Asia 28, 799–807 (2023).
Qing Wang, Guanghui Jiang, Luxia Yan, Rui Chen, Yufeng Liu et al. Association of atherogenic index of plasma with early neurological deterioration in patients with acute ischemic stroke. Clin. Neurol. Neurosurg. 234, (2023).
Kong, D. and Zou, W. Association between atherogenic index of plasma and post-stroke depression : a cross-sectional study. Eur. J. Psychotraumatol. 15, 1–11 (2024).
Myat Su Bo , Whye Lian Cheah , Soe Lwin , Tin Moe Nwe, Than Than Win, and Myint Aung.
Understanding the Relationship between Atherogenic Index of Plasma and Cardiovascular Disease Risk Factors among Staff of a University in Malaysia. J. Nutr. Metab. 2018, (2020).
S.BhardwaJ, J. Bhattacharjee, M.K Bhatnagar, S. Tyagi. Atherogenic index of plasma, castelli risk index and atherogenic coefficient- new parameters in assessing cardiovascular risk Int J Pharm Bio Sci 3, 359–364 (2013).
Umuerri, E. M. Pattern and Atherogenic Index o f Dyslipidaemia a mong Hypertensive Patients Schéma et indice athérogène de la dyslipidémie chez les patients hypertendus. Res. J. Heal. Sci. 4, (2020).
Aurora Carrión-Martínez, Benjamin J R Buckley, Esteban Orenes-Piñero,Francisco Marín, Gregory Y. H Lip, José Miguel Rivera-Caravaca. Anthropometric Measures and Risk of Cardiovascular Disease : Is there an Opportunity for Non-Traditional Anthropometric Assessment ? A Review. Rev. Cardiovasc. Med 23, 414 (2022).
Lee, J. Simply the Best : Anthropometric Indices for Predicting Cardiovascular Disease. Diabetes Metab J 43, 156–157 (2019).
Cakir, F., Erdogdu, H. I. and Atalay, E. Anthropometric Measurements and Analysis Results of Metabolic Parameters of Those with Impaired Fasting Glucose and Impaired Glucose Tolerance. Kafkas J Med Sci 12, 122–126 (2022).
Elsayed, H. and Bakry, K. Anthropometric and Metabolic Parameters to Detect Insulin Resistance in Children. Egypt. J. Hosp. Med. 89, 6132–6137 (2022).
Liang, H., Zhang, Q., Hu, Y. and Liu, G. Hypertriglyceridemia : A Neglected Risk Factor for Ischemic Stroke ? J. Stroke 24, 21–40 (2022).
Minal Jain, Anunaya Jain, Neeraja Yerragondu, Robert D. Brown, Alejandro Rabinstein, Babak S. Jahromi, Lekshmi Vaidyanathan, Brian Blyth, L. G. S. The Triglyceride Paradox in Stroke Survivors: A Prospective Study. Neurosci. J. 2013, 7 pages (2013).
Dziedzic, T., Slowik, A., Gryz, E. A. and Szczudlik, A. Research Report. Stroke 1–2 (2004) doi:10.1161/01.STR.0000128705.63891.67.
Anne E. Sumner, Gloria L. Vega, David J. Genovese, Karl B. Finley, Richard N. Bergman and Raymond C. Boston. Normal triglyceride levels despite insulin resistance in African Americans: Role of lipoprotein lipase. Metabolism. 54, 902–909 (2005).
Sumner, A. E. Ethnic Differences in Triglyceride Levels and High-Density Lipoprotein Lead to Underdiagnosis of the Metabolic Syndrome in Black Children and Adults. J. Pediatr. 155, S7.e7-S7.e11 (2009).
Sophia S.K. Yu, Darleen C. Castillo, Amber B. Courville, and Anne E. Sumner. The Triglyceride Paradox in People of African Descent. Metab Syndr Relat Disord. 10, 77–82 (2012). Goedecke, J. H. Expanding Our Understanding of the Triglyceride Paradox in Populations of African Ancestry. Circ. Res. 126, 109–111 (2020).
Hongbing Liu, Kai Liu, Lulu Pei, Shen Li, Jiawei Zhao. et al. Atherogenic Index of Plasma Predicts Outcomes in Acute Ischemic Stroke. Front. Neurol 12, 1–10 (2021).
Shadi Yaghi, MD, M.S. V. E. Lipids and Cerebrovascular Disease Research and Practice. Stroke 46, 3322–3328.
Kim, J. S. Role of Blood Lipid Levels and Lipid-Lowering Therapy in Stroke Patients with Different Levels of Cerebral Artery Diseases : Reconsidering Recent Stroke Guidelines. J. Stroke 23, 149–161 (2021).
Nirmala, A. C. and Hrishikesh, S. A cross-sectional study of lipid profile in stroke patients. Int. J. Adv. Med. 7, 687–693 (2020).